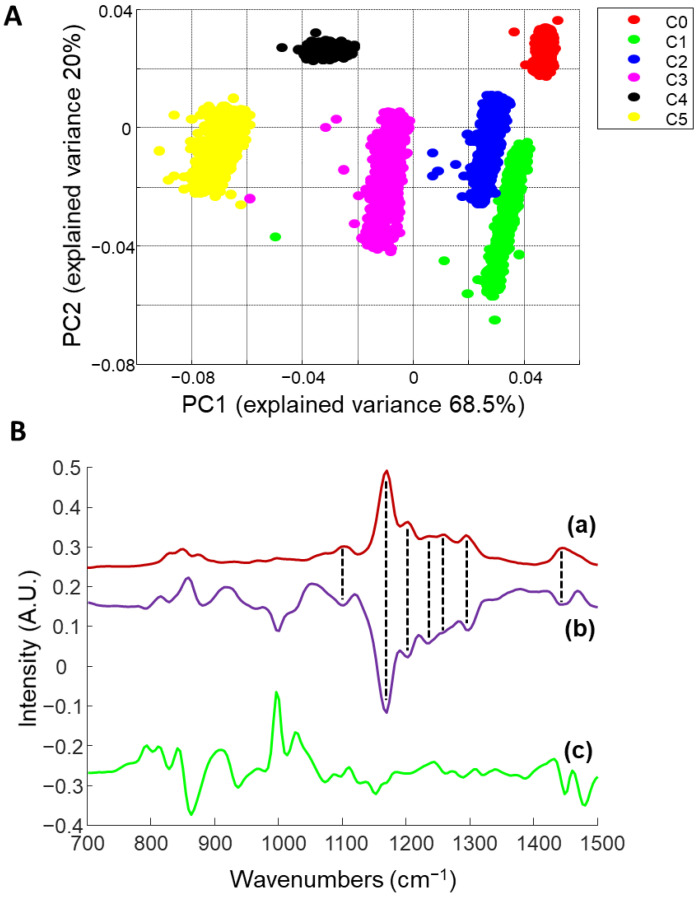
Figure 6.
(A): Scatter plot from principal component analysis (PCA) performed on PVA-GS films with increasing NanoPHE concentrations (C0: red, C1: green, C2: blue, 3: pink, C4: black, and C5: yellow). (B): Loading 1 (b) and Loading 2 (c) of the PCA (b) compared to the reference spectra of NanoPHE (a). Spectra are offset for clarity.

