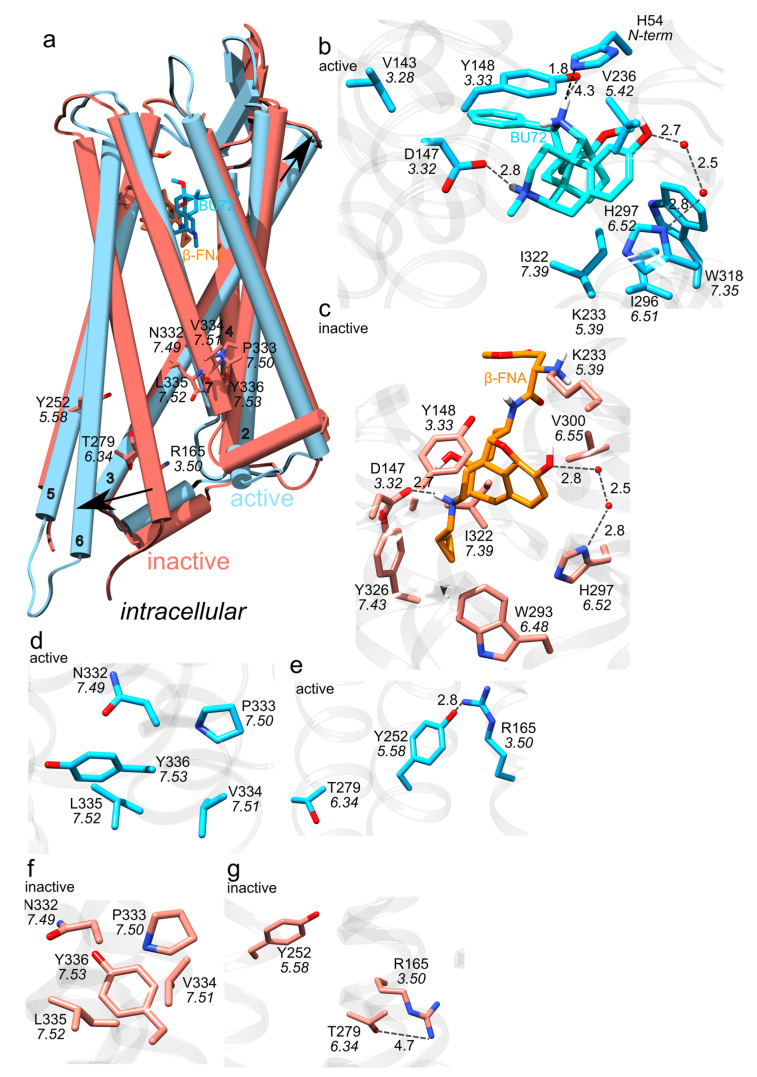
Figure 3.
Active vs. inactive MOR. (a) Overlap of the structures of active-MOR (blue) and inactive-MOR (red); three-dimensional structures are from PDB ID:5C1M [32] and PDB ID:4DKL [33], respectively. The black arrows indicate that TM3 and TM6 have distinct orientations in the two protein structures. (b,c) Close view of binding site interactions in structures bound to the agonist BU72, vs. the antagonist β-FNA. Blue carbon bonds represent interactions in the active receptor, and orange, in the inactive receptor. Grey dotted lines represent H-bond interactions. (d,f) Close view of the NPxxY motif in active (blue bonds) vs. inactive MOR (orange bonds). (e,g) Close view of the ionic lock. R3.50 interacts with T6.34 in inactive MOR (orange bonds), vs. with T5.58 in active MOR (blue bonds). Molecular graphics were prepared using UCSF Chimera 1.14 [23] and the text was added with Inkscape 1.0.

