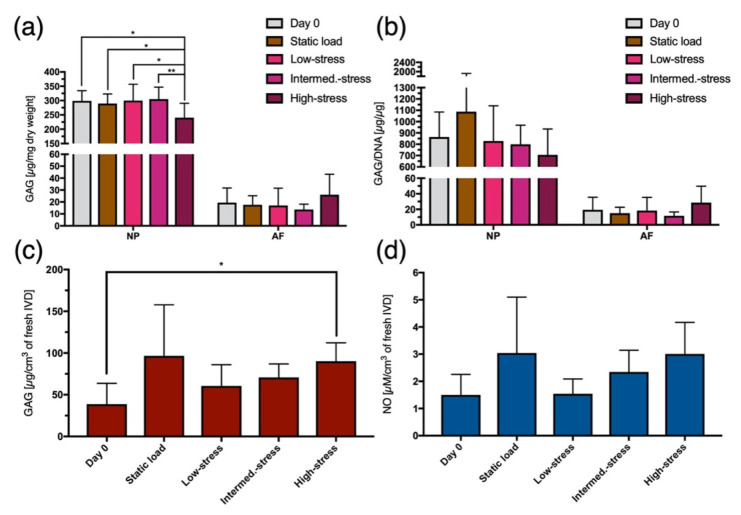
Figure 2.
(a) GAG content in the nucleus pulposus (NP) and in the annulus fibrosus (AF) relative to their tissue dry weight. (b) GAG content in the NP and AF tissue relative to their DNA content. (c) Amount of GAG released from the IVDs into the culture medium in relation to the IVDs’ volume after their isolation from a bovine tail. (d) Amount of NO released from the IVDs into the culture medium in relation to the IVDs’ volume after their isolation from a bovine tail. Mean ± SD, N = 6–7, p-value: * <0.05, ** <0.01.

