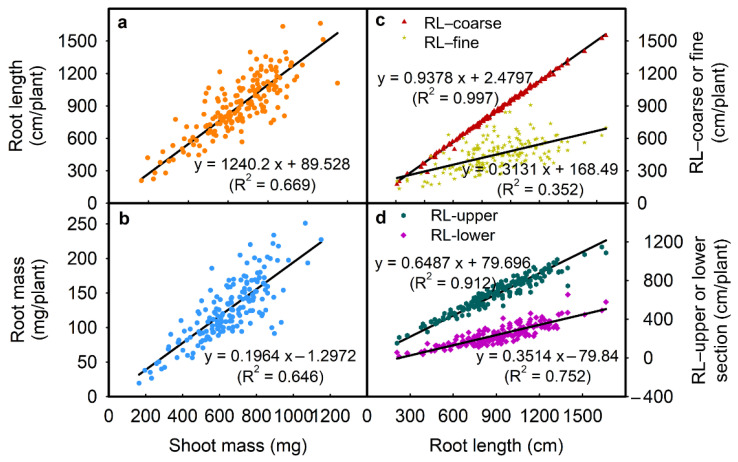
Figure 4.
Correlation between (a) shoot mass and root length, (b) shoot mass and root mass, (c) root length and RL-coarse or RL-fine, and (d) root length and RL-upper or RL-lower in 171 soybean genotypes grown in a semi-hydroponic phenotyping platform 39 days after sowing. Each dot represents the mean values of three replicates.

