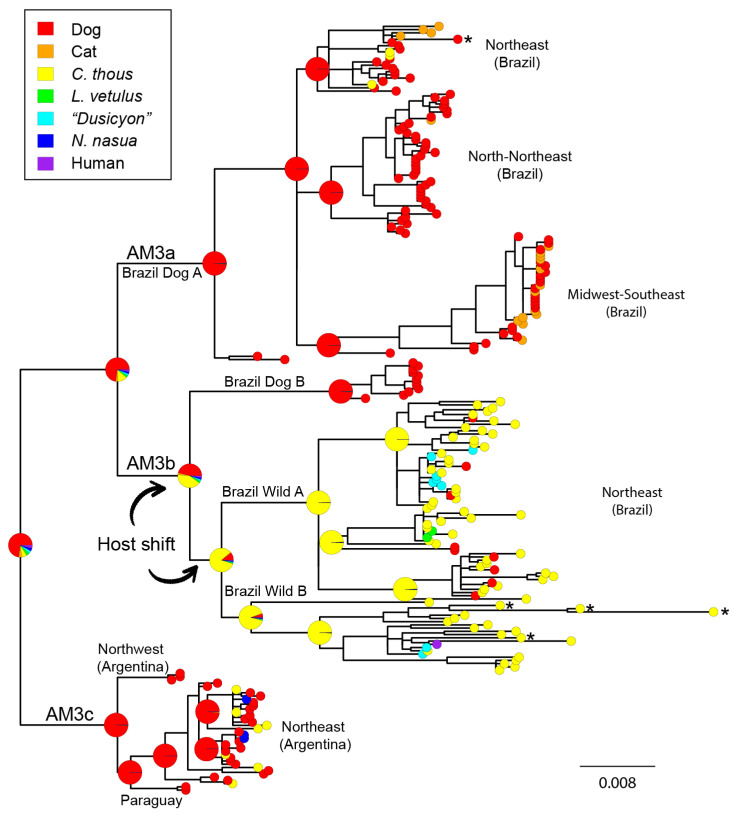
Figure 2.
Bayesian ancestral host reconstruction of 237 AgV2 complete N gene sequences. The phylogenetic tree covers the complete distribution, host species, and temporal ranges of this variant. Colored tip nodes show the host species of each sample. Pie charts are shown for relevant nodes and represent uncertainty in ancestral states reconstruction. Upper-left: Reconstruction of the place of origin, initial spread, and secondary spread of AgV2. The scale bar represents substitutions per site. Asterisks denote recombinants for the three corroborated events.

