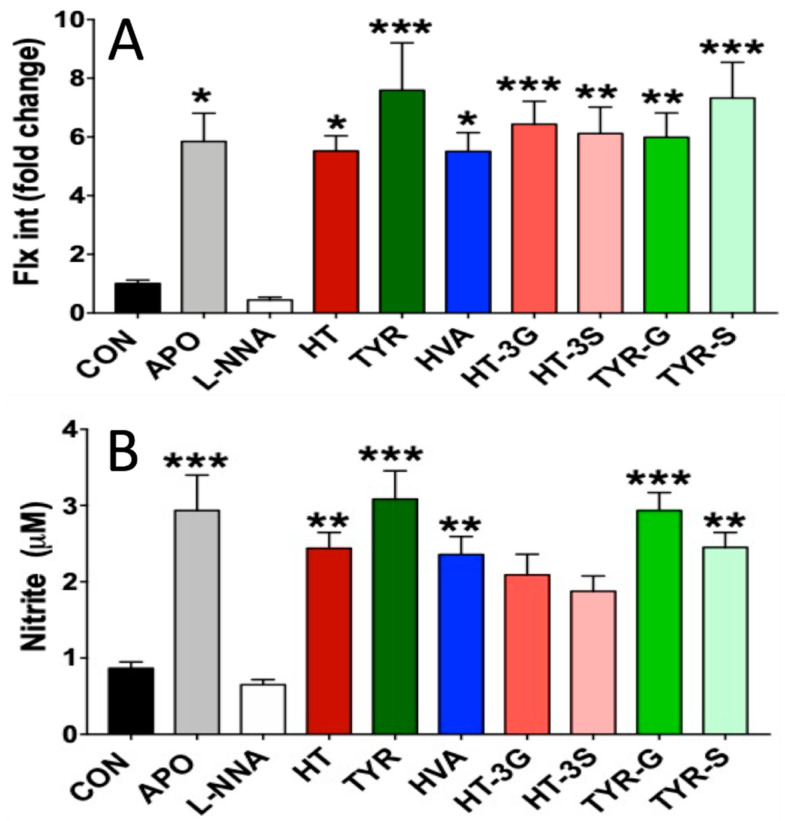
Figure 3.
NO levels, measured as DAF-2DA fluorescence (A), and Nitrite levels (B) in HAEC cells exposed to EVOO phenolics and metabolites (1 µM), apocynin (100 µM), or L-NNA (100 µM) for 24 h. CON = control; APO = apocynin; L-NNA = L-Nω-nitro-arginine; HT = hydroxytyrosol; TYR = tyrosol; HVA = homovanillyl alcohol; HT-3G = hydroxytyrosol-3-glucuronide, HT-3S = hydroxytyrosol-3-sulfate, TYR-G = tyrosol-glucuronide; TYR-S = tyrosol-sulfate. Data were obtained from 4 independent experiments, each performed in triplicates, and presented as average ± SEM. P > 0.05 vs. control (N = 12). * P < 0.05, ** P < 0.01, *** P < 0.001 vs. control.

