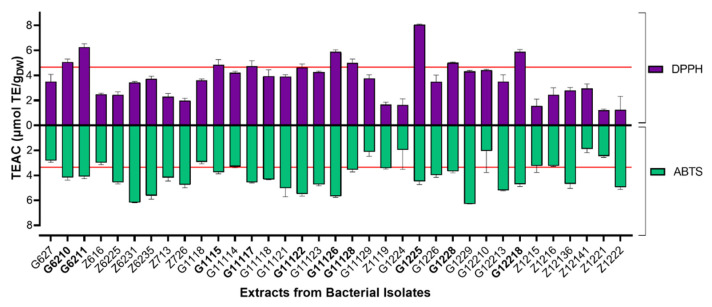
Figure 2.
Antioxidant screening of actinobacterial methanolic extracts. Purple bars represent DPPH assays and green bars represent ABTS assays. Each TEAC (Trolox equivalent antioxidant capacity) value is expressed as the mean (n = 3), and error bars represent standard deviation (SD). Red lines indicate TEACs of 4.66 and 3.35 values for the DPPH and ABTS assays, respectively.

