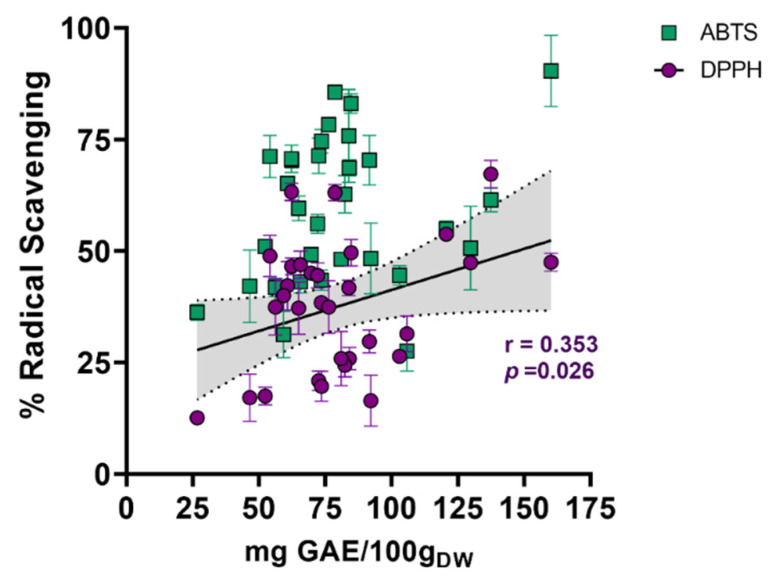
Figure 3.
Correlation between antioxidant capacity assays and phenolic content. The results of ABTS and DPPH assays are shown as green squares and purple circles, respectively. P-value was determined by the Pearson correlation coefficient. Total phenolic content is expressed as milligrams of gallic acid equivalents per 100 g of dry weight (mg GAE/100gDW).

