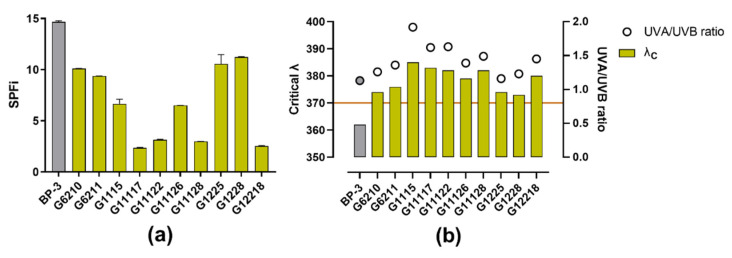
Figure 4.
UV-absorbing profile of the actinobacterial methanolic extracts: (a) Results of SPFi calculations; (b) Results of the UV-A protection profile; the left y-axis shows the critical wavelength (λC; the orange line indicates the threshold to claim broad-spectrum protection, i.e., 370 nm), and the right y-axis shows the UVA/UVB ratio. BP-3, which was used as a reference compound, is shown in gray.

