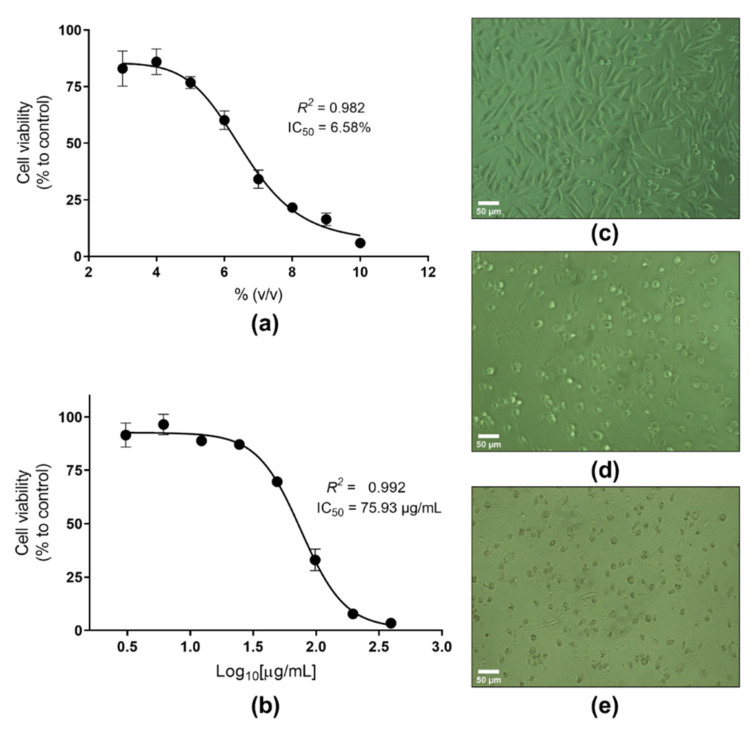
Figure 5.
Cytotoxic evaluation of oxybenzone: (a) concentration–response curve of DMSO (between 10 and 3% v/v), (b) concentration–response curve of oxybenzone (between 400 and 3 µg/mL), (c) micrograph of HDFa cells in normal conditions, (d) micrograph of HDFa cells after 24 h the exposure to DMSO (9% v/v), (e) micrograph of HDFa cells exposed to oxybenzone (200 µg/mL) during 24 h.

