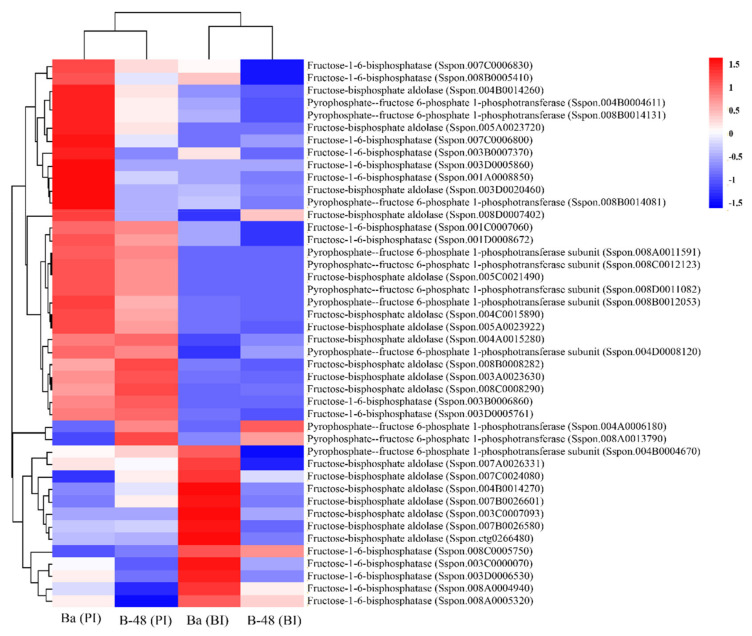
Figure 2.
Differential gene expression involved in sugar metabolism in Ba (BI), Ba (PI), B-48 (BI), and B-48 (PI). The number of transcripts involved in fructose synthesis. Upregulated DEGs are shown in red color while down-regulated DEGs are in blue. Ba (BI): Badila (Before Infection); Ba (PI): Badila (Post Infection); B-48 (BI): B-48 (Before Infection); B-48 (PI): B-48 (Post Infection).

