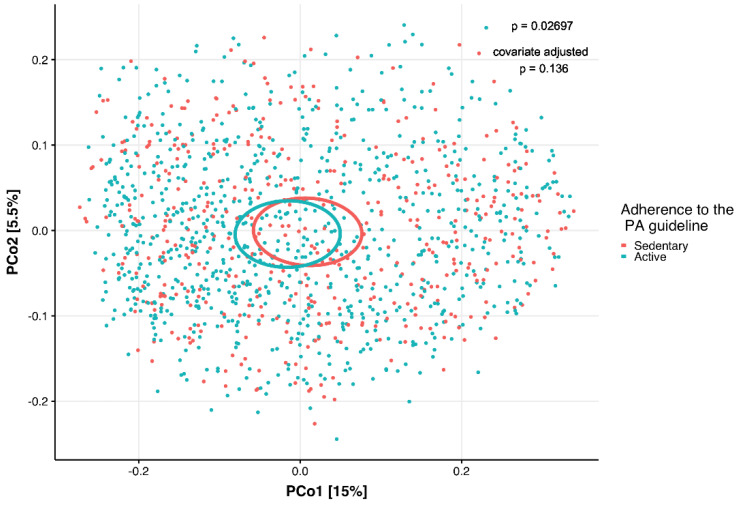
Figure 2.
Principal Coordinate Analysis (PCoA) plot of the unweighted UniFrac distance of the study population categorized by adherence to the Dutch physical activity (PA) guideline (red dots, sedentary participants, n = 440, one participant with missing value for BMI was excluded); blue dots, active participants, n = 868; permutational analysis of variance (PERMANOVA) p = 0.027, covariate adjusted p = 0.136) based on the Short Questionnaire to Assess Health-enhancing physical activity (SQUASH). Covariates used are ethnicity, age, sex, and body mass index (BMI).

