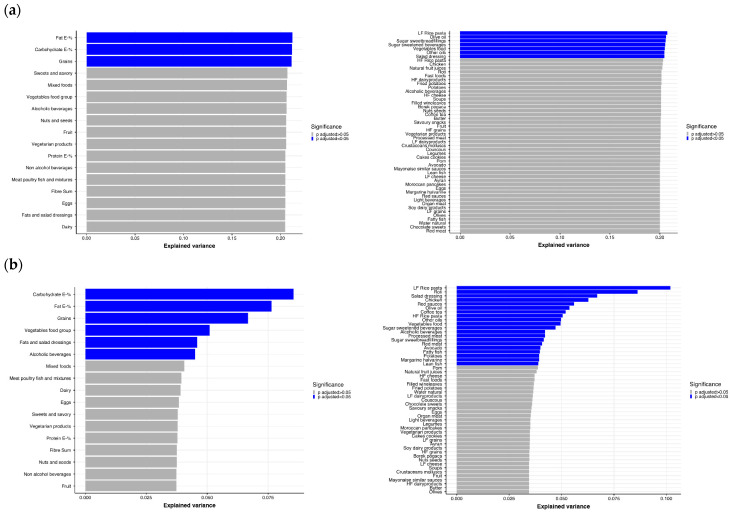
Figure 6.
Explained variance of Shannon α-diversity index (n = 1308) by the major 13 foods groups (including macronutrients, carbohydrate E-%, protein E-% and fat E-%) and 52 foods in multivariable linear regression: (a) model adjusted for ethnicity, sex, age, and body mass index (BMI), 8 df; (b) model adjusted for sex, age, and BMI, 4 df. Significance level colored with blue when FDR-p < 0.05, grey when FDR-p > 0.05. E-%, energy intake expressed as energy percentage of total energy; HF cheese, high-fat cheese; HF dairy products, high-fat dairy products; HF grains, high-fiber grains; HF rice pasta, high-fiber rice pasta; LF cheese, low-fat cheese; LF grains, low-fiber grains; LF dairy products, low-fat dairy products; LF rice and pasta, low-fiber rice and pasta.

