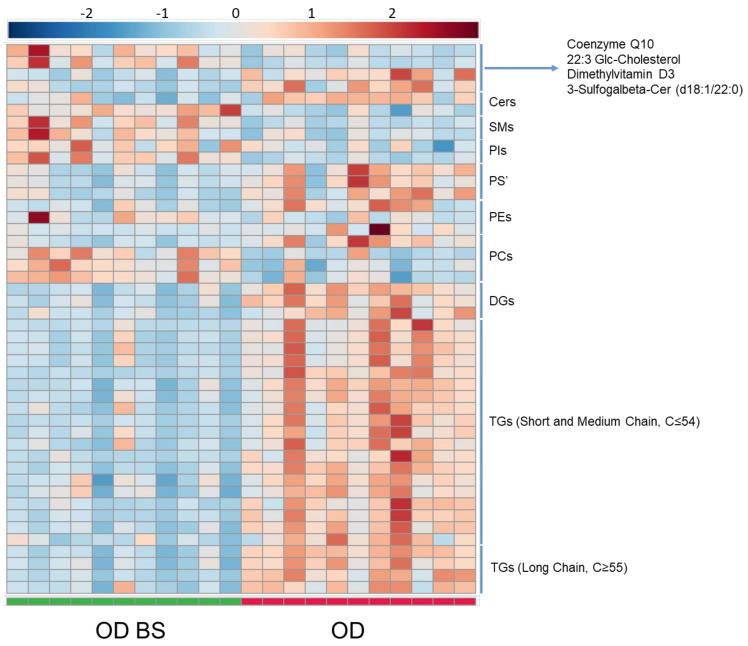
Figure 5.
Heatmap for OD BS vs. OD comparison in serum analyzed by LC-MS. Heatmap was generated with the peak intensities of the significant compounds found between OD BS and OD patients in the serum analyzed by LC-MS. OD patients (right) were represented with red color. OD BS patients (left) were represented with green color. Abbreviations: TG, Triglycerides. DG, Diglycerides. PC, Phosphatidylcholine. Cer, Ceramide. SM, Sphingomyelin. PI, Phosphatidylinositol. PE, Phosphatidylethanolamine. PS, Phosphatidylserine.

