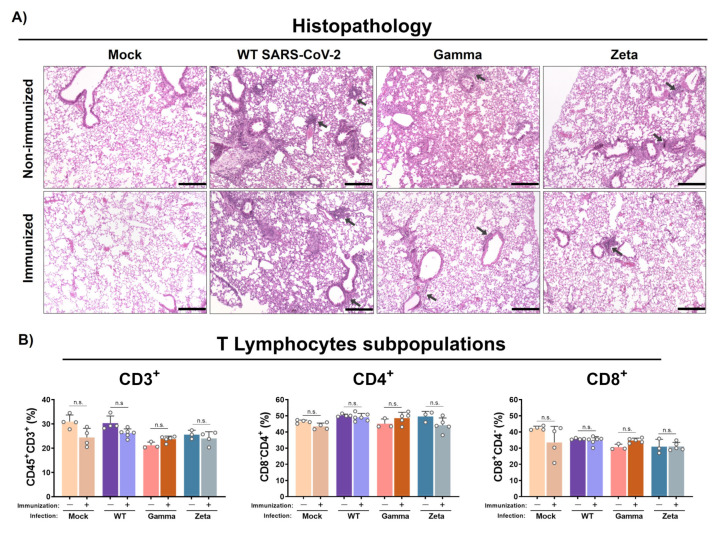
Figure 5.
Histopathology and T lymphocyte subpopulation analysis from mouse lungs. Lungs from immunized and nonimmunized mice were collected after 3 days of infection. (A) Superior right lobe processed and stained with H&E. (B) Middle and inferior lobes collected and evaluated for recruitment of T lymphocyte subpopulations. n = 3 for nonimmunized groups and n = 5 for immunized groups. Black arrows, mixed inflammatory infiltrates. Scale bar = 200 µm. Statistical analysis conducted by one-way ANOVA followed by Tukey’s post hoc test. n.s. = not statistically significant.

