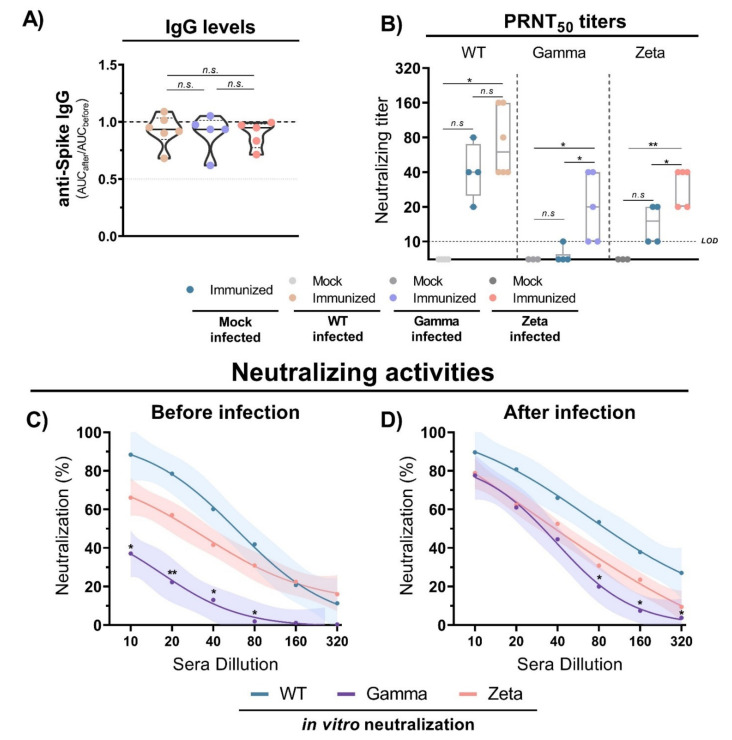
Figure 6.
Antibody titers and neutralization activity in mice immunized with WT SARS-CoV-2 and infection with different viral lineages. (A) Anti-S IgG level ratio from immunized mice sera before and after viral infection with WT SARS-CoV-2, Gamma or Zeta lineages, normalized. N= 5–6 animals/group (indicated on figure). Multiple comparisons performed by ordinary one-way ANOVA followed by Tukey’s post hoc test. (B) Neutralizing titers in PRNT50 of immunized (n = 4) and nonimmunized (n = 3) mouse sera before and after viral infection with WT SARS-CoV-2 (n = 6), Gamma (n = 5), or Zeta (n = 5) lineages. (C,D) Neutralizing profile against WT SARS-CoV-2, Gamma, or Zeta lineages from immunized mouse sera before (n = 4) and 3 days after (n = 6, for each group) viral infection. Nonlinear regression curves generated with a maximum of 1000 interactions and 95% confidence interval. Error bars delimited by colors. Multiple comparisons performed by two-way ANOVA followed by Tukey’s post hoc test. * p < 0.05; ** p < 0.001. AUC = area under curve; PRNT50 = 50% plaque reduction neutralization test; LOD = limit of detection; n.s. = not statistically significant.

