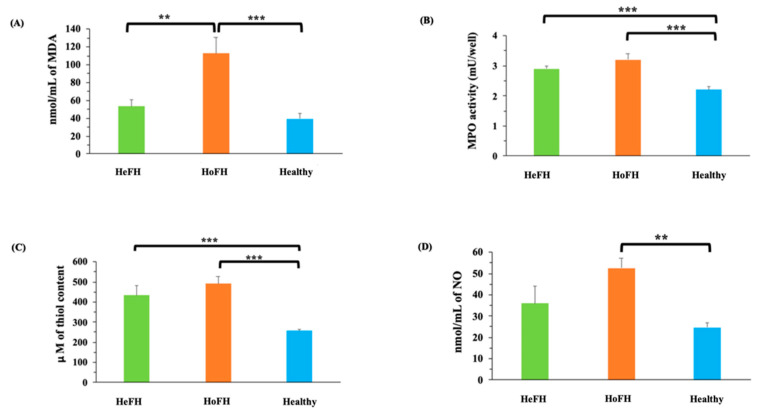
Figure 1.
Comparison of (A) the MDA levels; (B) MPO activity; (C) the total thiol content; (D) the NO levels of serum between the studied groups. Data are expressed as mean ± SE. ** p < 0.01, *** p < 0.001. HeFH: Heterozygous familial hypercholesterolemia; HoFH: Homozygous familial hypercholesterolemia; MDA: Malondialdehyde; MPO: Myeloperoxidase; mU/well: milliunit per well; nmol/mL: Nanomol per milliliter NO: Nitric oxide; μM: Micromolar.

