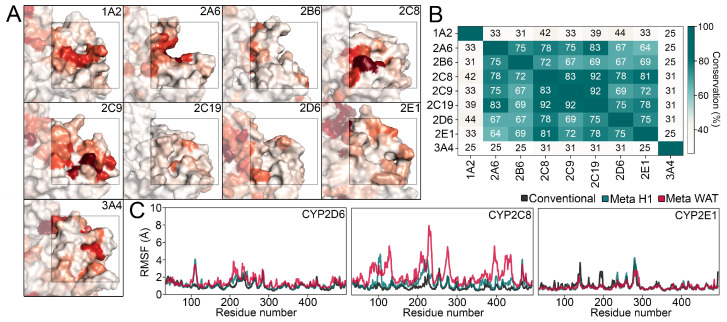
Figure 2.
(A) Small-molecule binding hotspots on the surface of the nine enzymes studied in this work. Different shades of red indicate the degree of ligand association per residues as described in the Materials and Methods section. (B) Heatmap depicting the conservation of the H1 site within the panel of CYPs. (C) Analysis of structural changes observed in metdynamics simulations.

