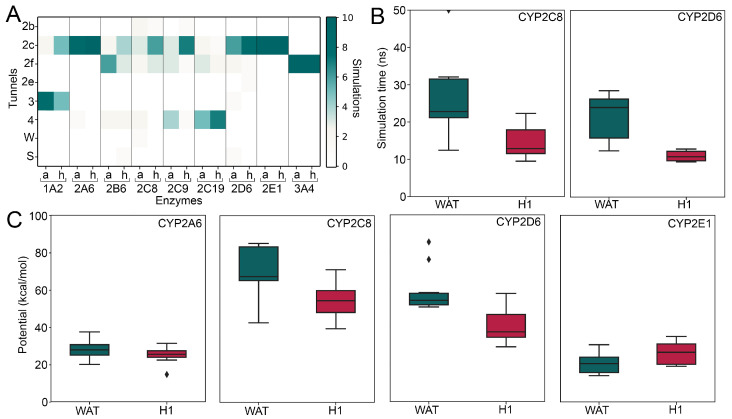
Figure 3.
Results from metadynamics simulations. (A) Heat map of selected pathways with (h) and without (a) allosteric ligand. (B) Boxplots of simulation times (T) until the ligand completely dissociated from the active site. (C) Boxplots of maximal potential (Pmax) registered until the ligand completely dissociated from the active site. ⧫: allosteric ligand.

