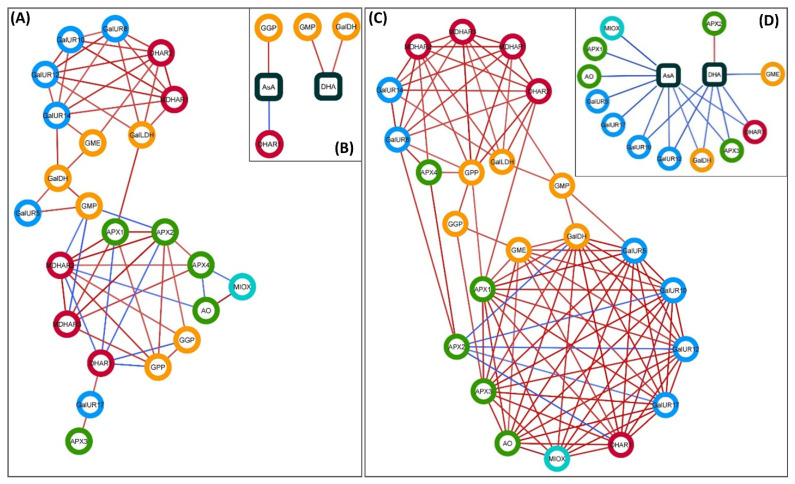
Figure 8.
Gene co-expression networks of genes involved in the ascorbic acid (AsA) metabolism in the flavedo (A) and pulp (C) of Valencia Late orange (Citrus sinensis) fruit, and gene-metabolite correlation networks of AsA and DHA contents and the expression of AsA metabolic genes in the flavedo (B) and pulp (D). In the networks, the color of the circle nodes indicates: yellow, L-galactose biosynthetic genes; blue, D-galacturonic biosynthetic genes; sky-blue, myo-inositol biosynthetic genes; green, AsA degradation genes; and red, AsA recycling genes; and the square nodes represent the metabolites AsA, ascorbic acid; and DHA, dehydroascorbic acid. Lines joining the nodes (edges) represent positive correlations (red color) and negative correlations (blue color). The color intensity of the lines represents the strength of the correlation (absolute value of the Pearson’s correlation coefficient). Only significant correlations (p-value ≤ 0.05) were taken into account for the construction of the networks. In the gene-metabolite networks (B,D), only connections between metabolites and genes are represented.

