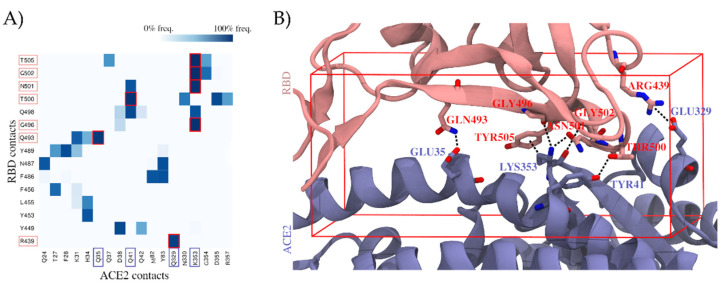
Figure 1.
Contribution of individual residues to the stability of the binding complex formed by the spike protein’s receptor-binding domain (RBD) and the angiotensin-converting enzyme 2 (ACE2), computed as contact frequencies. (A) Stability of RBD–ACE2 contacts. Heatmap of contact frequencies between RBD and ACE2 residues, where contact frequencies are represented as a color scale from white (0%) to dark blue (100%). In the red square are depicted those contacts that are maintained through >90% of the simulation, and the corresponding RBD and ACE2 residues are highlighted with salmon and blue squares, respectively, in the axis labels. Residues that do not form any interaction with frequency >50% were filtered out. (B) Structural mapping of the most stable contacts (contact frequency >90%) between RBD and ACE2. The interface region where these contacts are found was used to guide a virtual screening. The docking box applied in virtual screening is indicated in red.

