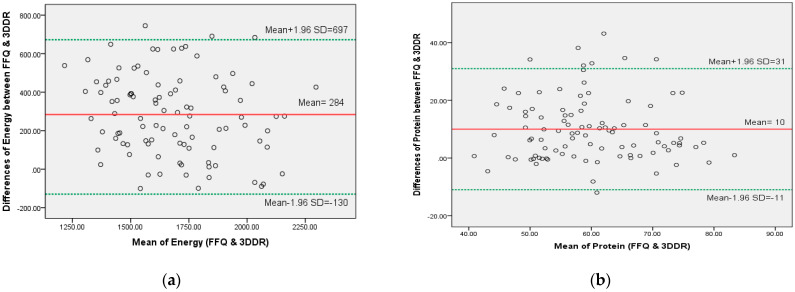
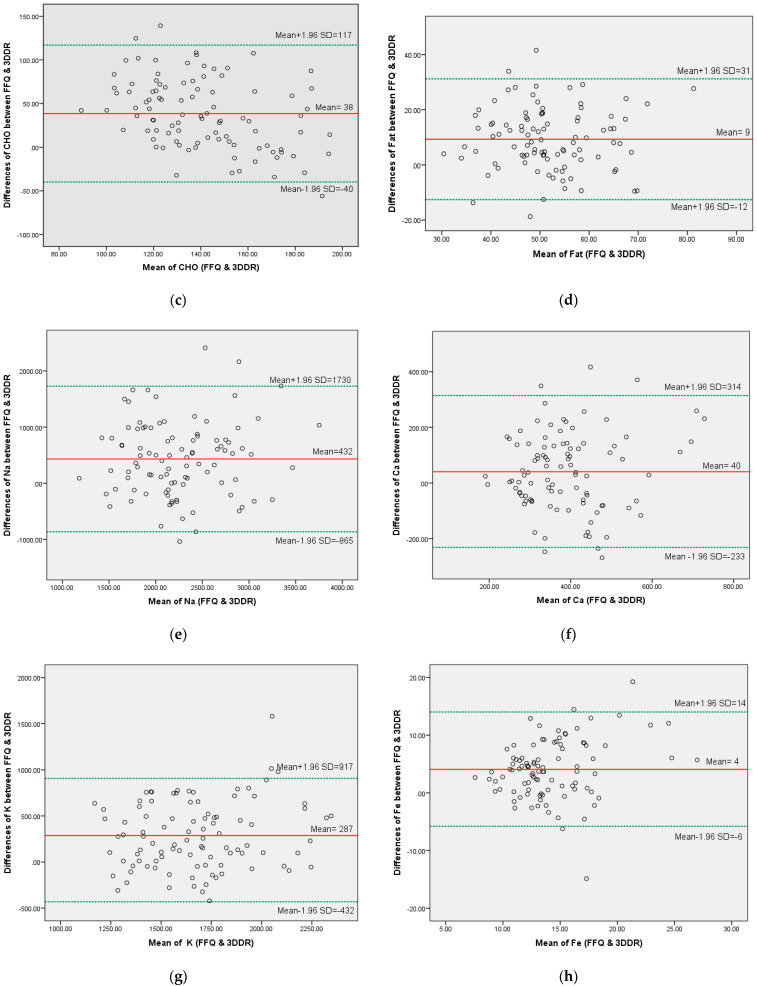
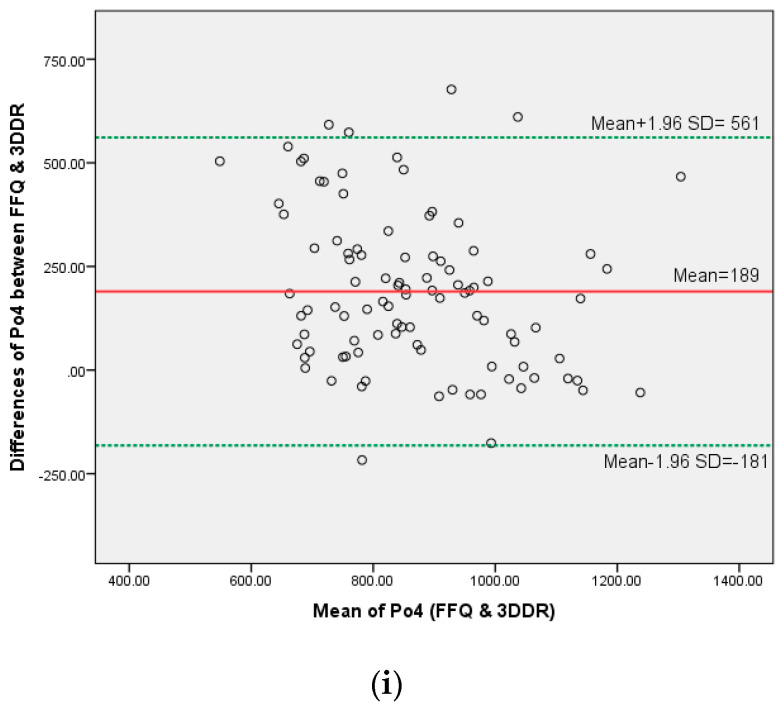
Figure 2.
Bland-Altman plots visualizing the agreement between the BDHD-FFQ and 3DDRs. Bland-Altman plots picturing the agreement between the BDHD-FFQ and 3DDRs to evaluate the intake of (a) energy, (b) protein, (c) carbohydrate, (d) fat, (e) sodium, (f) calcium, (g) potassium, (h) iron and (i) phosphate. For all plots, the middle red line represents the mean differences between the BDHD-FFQ and 3DDRs, and limits of agreement (green line) show the 95% confidence interval (mean ± 1.96 SD).


