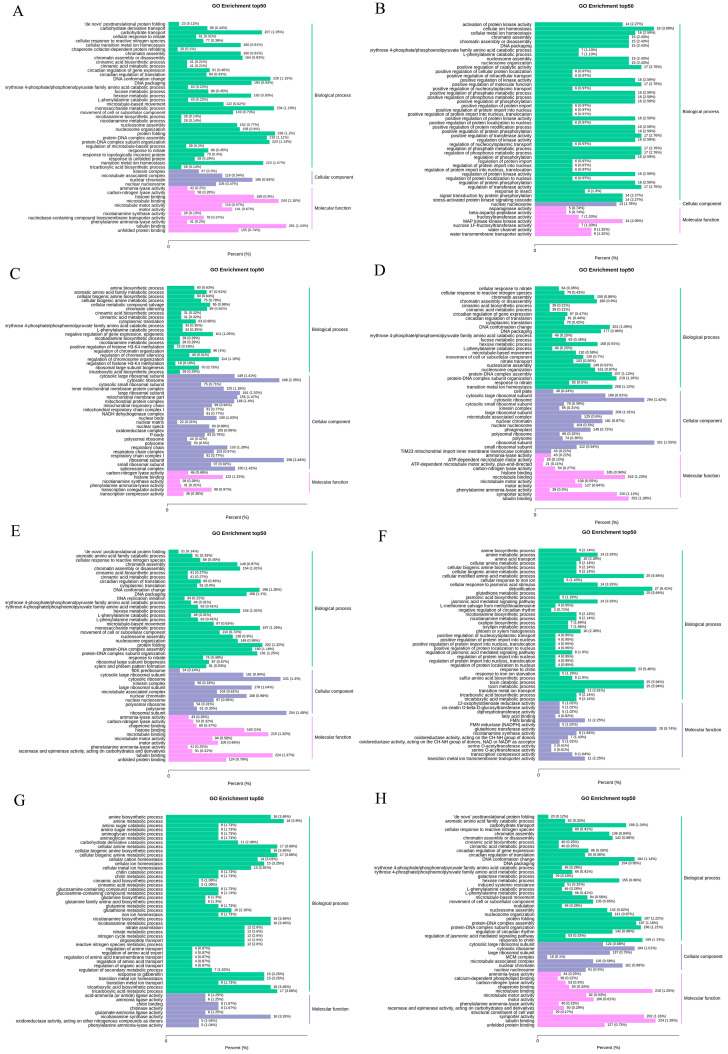
Figure 6.
GO enrichment analysis of differential genes. The abscissa represents the ratio of the genes annotated to the entry to the total number of genes annotated, and the ordinate represents the name of the go entry. The label on the right side of the graph represents the category to which the go entry belongs. (A) I_CK_vs_I_H; (B) I_CK_vs_I_Tre; (C) I_H_vs_I_TreH; (D) I_Tre_vs_I_TreH; (E) II_CK_vs_II_H; (F) II_CK_vs_II_Tre; (G) II_H_vs_II_TreH; (H) II_Tre_vs_II_TreH.

