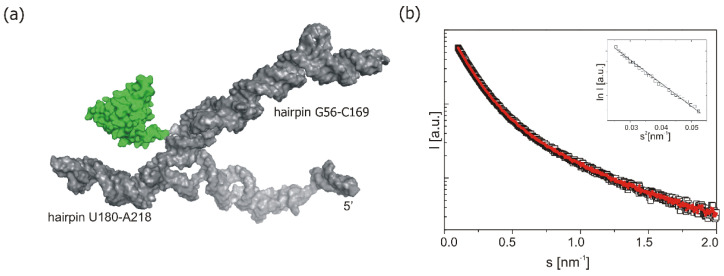
Figure 6.
SAXS data for P1-Δ40p53 RNA—PCBP2 complex. (a) Quaternary structure of the complex obtained by SASREF (grey—RNA model, green—protein model). (b) Experimental SAXS curve used to model the quaternary structure of the P1-Δ40p53 RNA—PCBP2 complex (black line) in the region 0.01–2 nm−1, the red line shows the theoretical fit to the experimental data (χ2 = 1.34). Guinier plot shows that the analysed system is monodisperse (insert).

