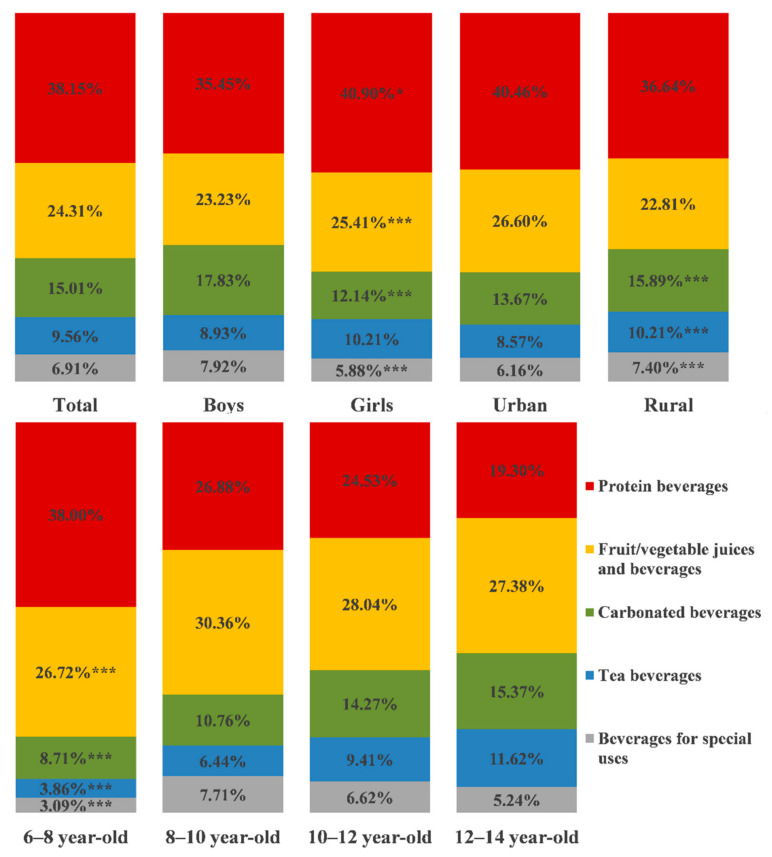
Figure 1.
Proportions of sugar intake from each kind of beverage in total sugar intake from beverages. Sources of sugar intake from each beverage by gender, age and residence (the proportion of total sugar intake from beverages, %). * p < 0.5, *** p < 0.001. Compared with by Mann–Whitney U test and Kruskal–Wallis test in non-parametric test. Detailed differences between groups are shown in Appendix D, Table A7.

