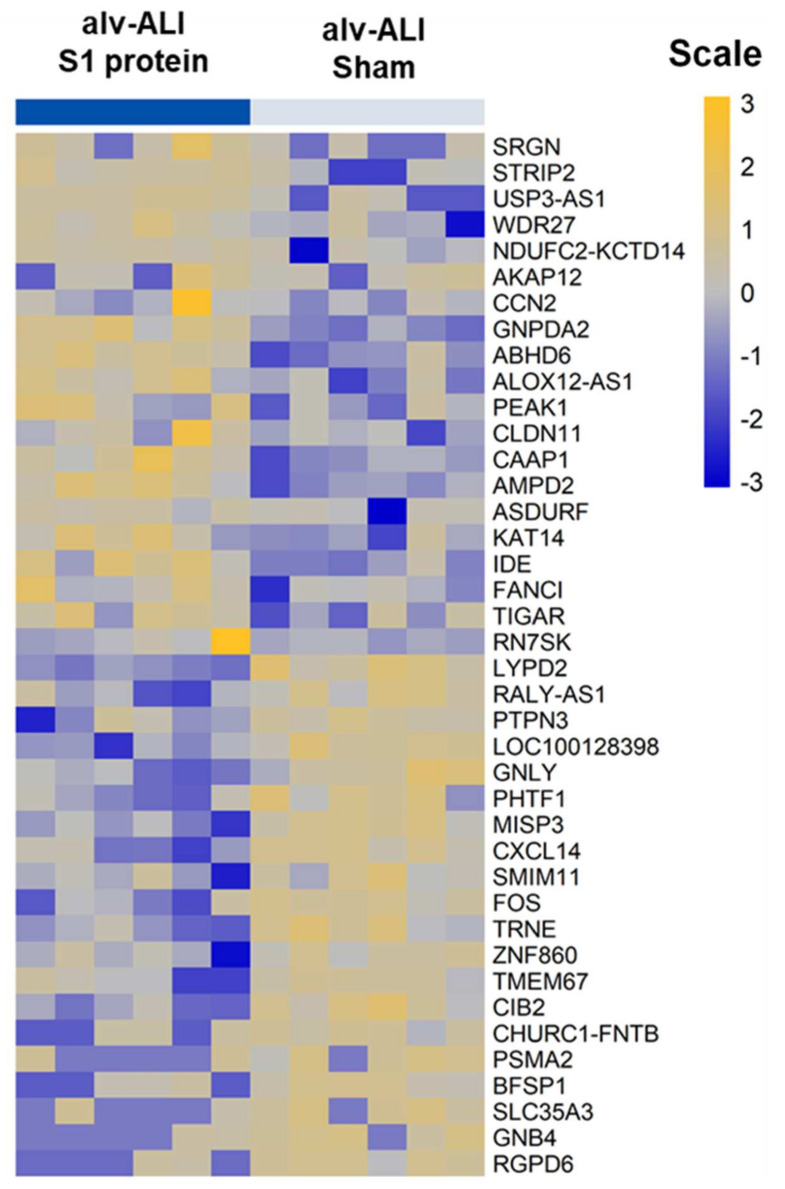
Figure 7.
Heatmap of top 20 upregulated and 20 downregulated genes in the alveolar mucosa model developed at air–liquid interface (alv-ALI). alv-ALI was exposed to 10 nM recombinant SARS-CoV-2 spike glycoprotein S1 (S1 protein) for 24 h and compared to the corresponding sham. n = 6 per exposure condition; significantly (raw p < 0.01) regulated genes with the highest fold changes are shown. Genes were ordered by fold-change (S1 protein vs. sham) and relative gene expression values are shown across samples (z-scales to mean expression per row).

