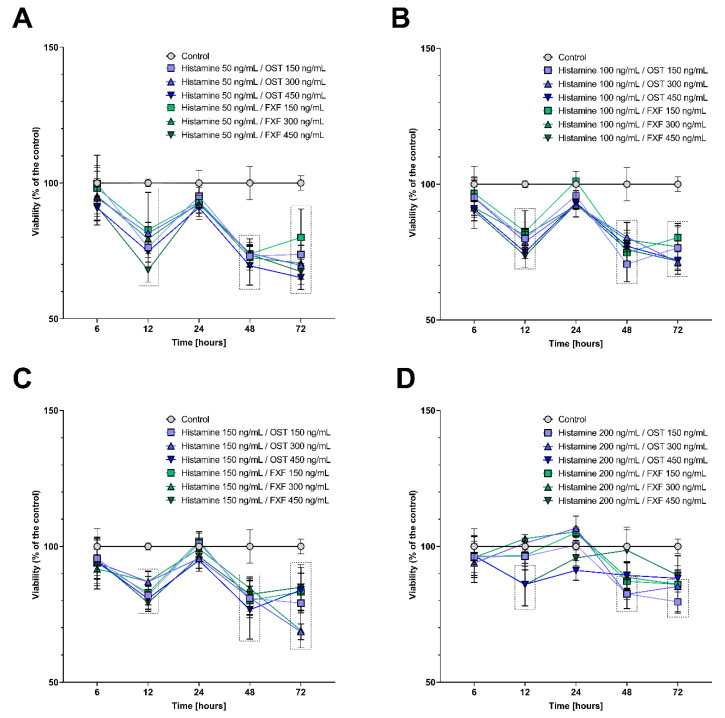
Figure 1.
Changes in viability of the Caco-2 cell line after incubation with 50 ng/mL (A), 100 ng/mL (B), 150 ng/mL (C), and 200 ng/mL of histamine (D) in mixtures with fexofenadine and osthole (150, 300, and 450 ng/mL). The symbols show the mean and the bars depict the standard deviation. Statistically significant differences compared to control, i.e., cells cultured in medium (p < 0.05, two-way ANOVA with Dunnett’s multiple comparisons test) are shown in rectangles with dotted edges. The analyzes were performed in triplicate in three independent experiments.

