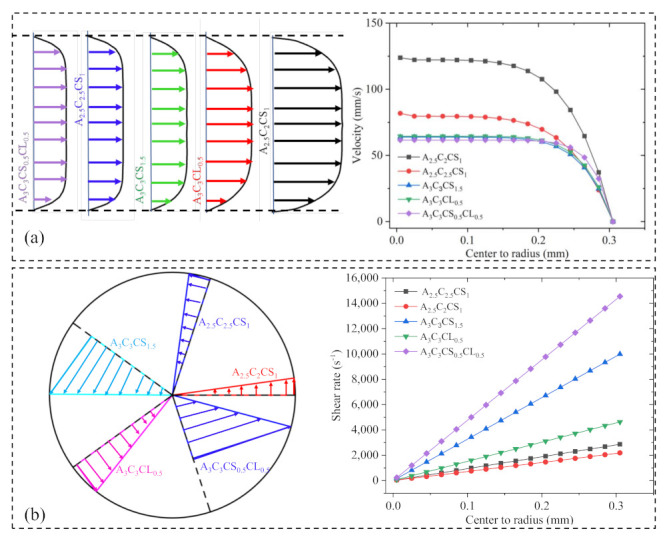
Figure 5.

(a) Velocity and (b) shear stress distribution of various compositions. Velocity and shear rate distribution were calculated based on the shear-thinning factors n, K, and filament diameters changed due to the applied pressure. (a) represents the width of velocity distribution is viscosity dependent, and (b) represents high viscous composition will have more shear stress near the nozzle wall.
