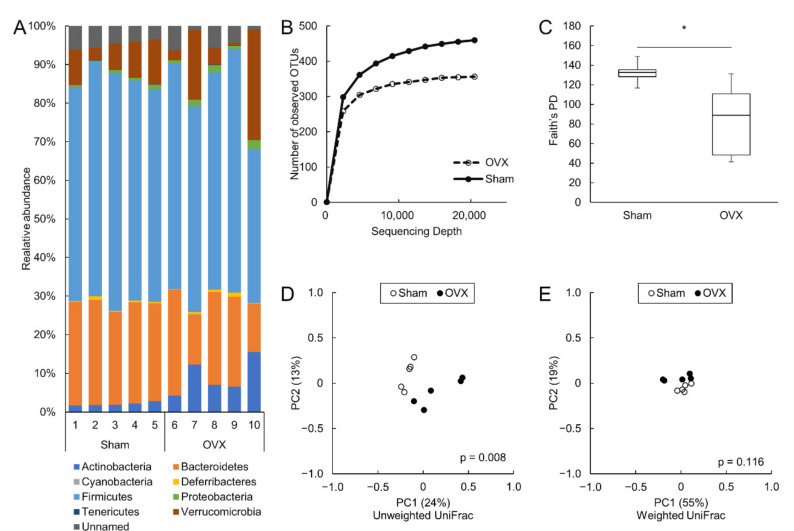
Figure 2.
Dysbiosis in colon induced by ovariectomy. (A): Colonic microbial composition at the phylum level. (B,C): Alpha diversity analysis of the colonic microbiota. Rarefaction curve using the number of observed operational taxonomic units (B) and Faith’s phylogenetic diversity (C). (D,E): Beta diversity analysis of colonic microbiota Unweighted UniFrac (D) and weighted UniFrac (E). N = 5 per group. OTU: operational taxonomic unit, PD: phylogenetic diversity. * p < 0.05.

