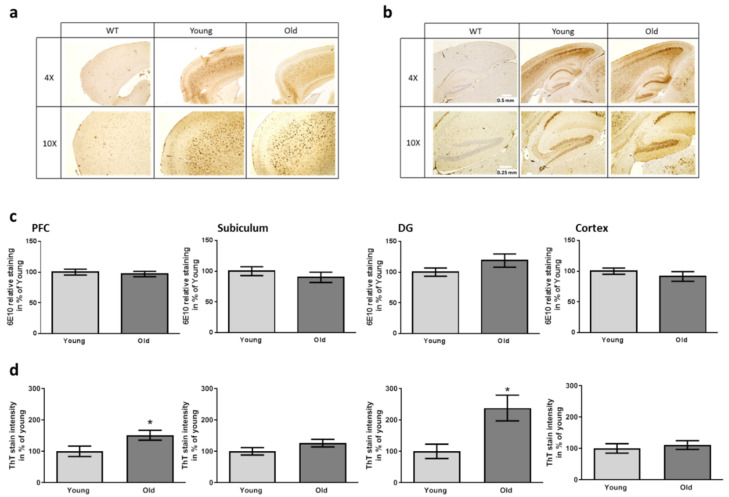
Figure 5.
Aβ and plaque staining in brain regions of 5xFAD mice after having received FMT. The area of the prefrontal cortex ((a), PFC) and the hippocampal area ((b), DG: dentate gyrus) were stained with antibody 6E10. Scale bars represent 0.5 and 0.25 mm (4× and 10× magnification). Exemplary pictures in comparison to a wild type sample are shown. (c) Quantitative analysis of the staining intensity using defined area-sizes (as described previously [32]). (d) Quantitation of ThT-dependent plaque staining. For exemplary pictures of this staining please see Supplementary Figure S4. Two slides per mouse were analyzed. Data are presented as mean ± SEM in % of the mean of animals treated with caecum content from young donors ((c,d): n = 9 for transgenic mice treated with cecal material from young and 10 for mice treated with old donor material (designated “young” and “old”) (*, p < 0.05)).

