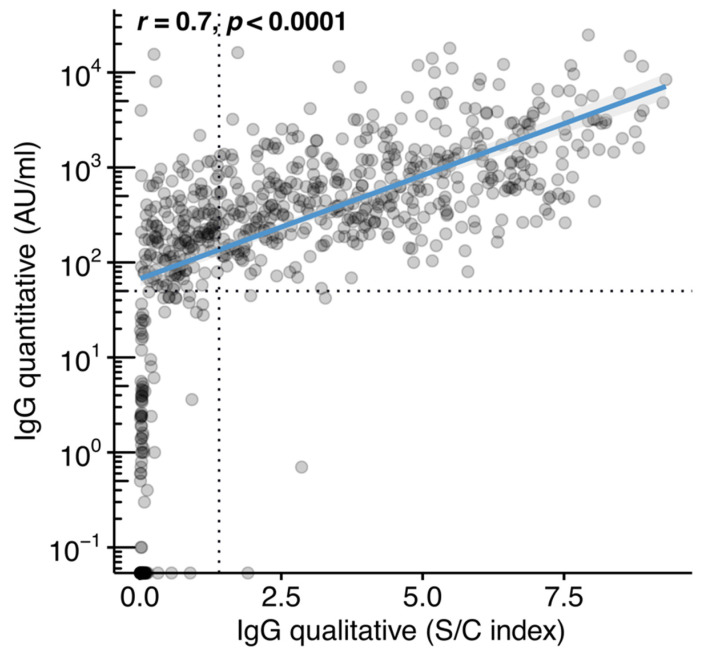
Figure 1.
Correlation between the anti-SARS-CoV-2 immunoglobulin class G (IgG) quantitative and IgG qualitative assays. IgG (S/C) index plotted against IgG antibody levels in arbitrary units (AU)/mL. The analysis included 734 unvaccinated individuals with matched measurements for both assay types. Dotted lines represent the limits of detection for each assay and blue line represents linear regression fit. Spearman’s correlation test was used to calculate correlation coefficients (r) and p-value (p).

