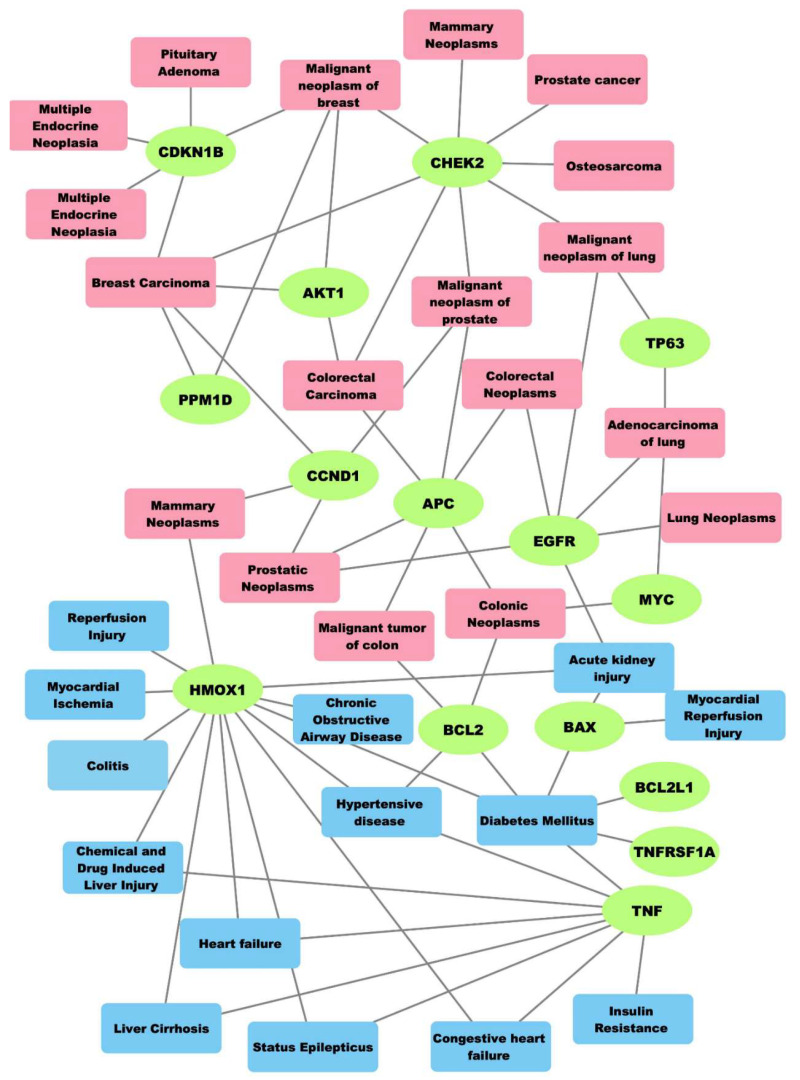
Figure 2.
Integrated network depicting the top-ranking pairwise relationships (indicated by edges or lines) between genes-neoplasms, and genes and non-neoplastic diseases, derived from DisGeNET; green: genes, magenta: neoplasms, blue: non-neoplastic diseases often appearing as comorbitidies in various types of cancer therapies, like radiation therapies.

