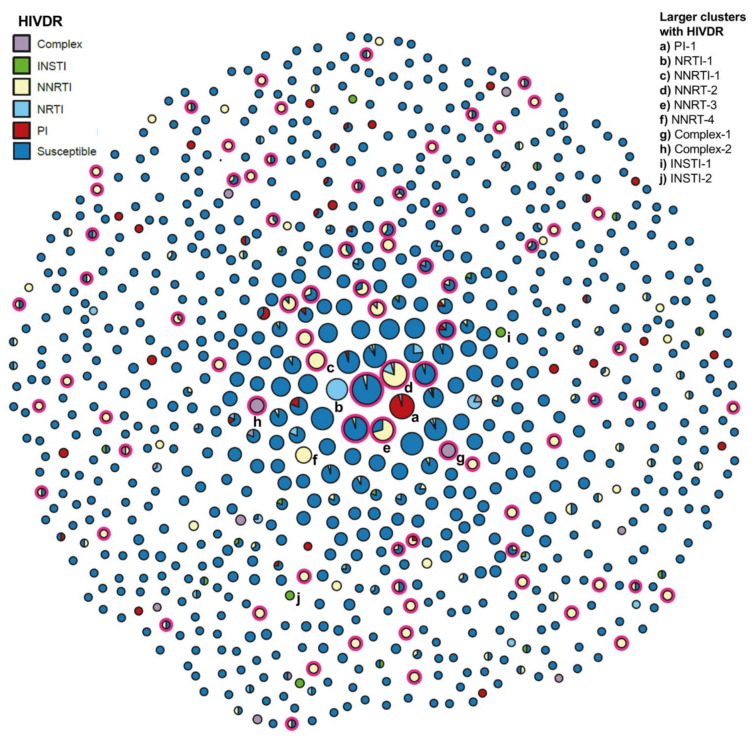
Figure 5.
PDR transmission within Mexico City’s HIV genetic network, 2017–2020. The network was inferred from 6688 protease-reverse transcriptase sequences from individuals arriving to care from 2017 to 2020, using a locally adapted version of the HIV-TRACE tool. Each circle represents a cluster. The size of the circle reflects the size of the cluster. Clusters are colored according to the presence of pretreatment drug resistance by drug class. Specific clusters mentioned in the text are identified with letters on the lower-right side. Red circles surrounding clusters show the presence of viruses with the K103NS mutation.

