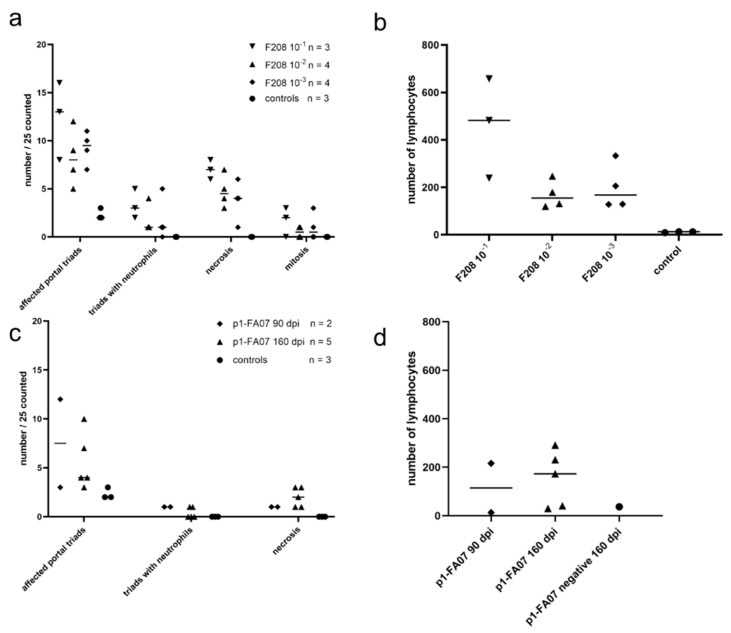
Figure 2.
Scatter plots showing individual values and medians (indicated by the horizontal lines) for wt-F208 (Hepacivirus J)-inoculated bank voles (experiment 3) and p1-FA07 (Hepacivirus F)-inoculated bank voles (experiment 4). Per animal, 25 liver triads were evaluated, and the affected portal triads, triads with neutrophils and lymphocytes were counted. In addition, per animal, 25 arbitrarily selected 400× fields were evaluated for the number of necrotic cells (degeneration) and cells in mitosis. (a,b) Experiment 3. Analyses of the dose-dependency of the pathological consequences of wt-F208 (Hepacivirus J) infection in bank voles. Differences between groups are significant for affected portal triads (p = 0.02), for triads with neutrophils (p = 0.03), for necrosis (p = 0.005) and for number of lymphocytes (p = 0.03), but not for mitosis (p = 0.390) using the Kruskal–Wallis test. (c,d) Experiment 4. Pathological consequences of p1-FA07 (Hepacivirus F) infection in bank voles at different time points post-inoculation. Statistical testing was not meaningful for these data, because of the low numbers of animals and lesions detected.

