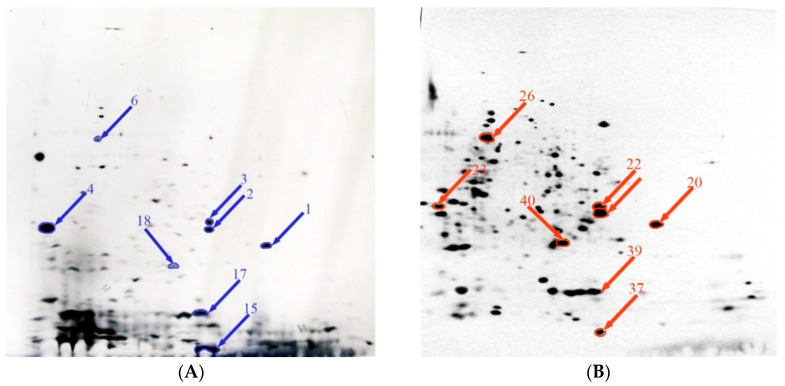
Figure 2.
Comparative proteomics analysis of the effect of alkaline stress on protein expression. Summary of various expression levels of Y. lipolytica total protein extracted under normal (A) and alkaline (B) stress conditions. Symbols: overexpressed proteins under normal (blue arrow) and alkaline stress (red arrow) condition.

