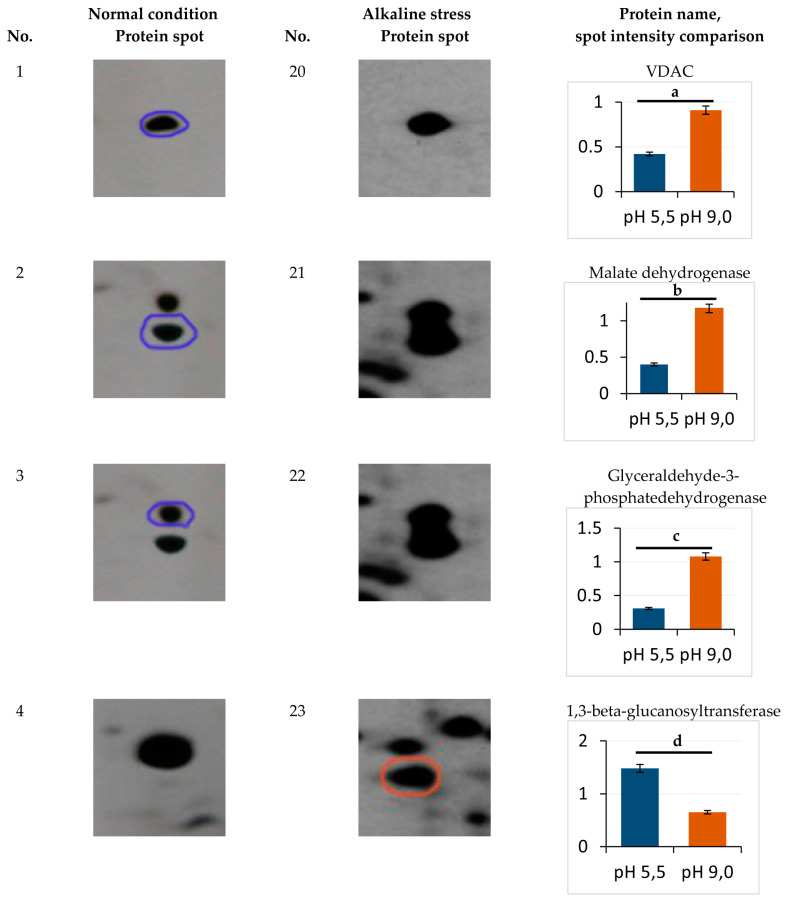
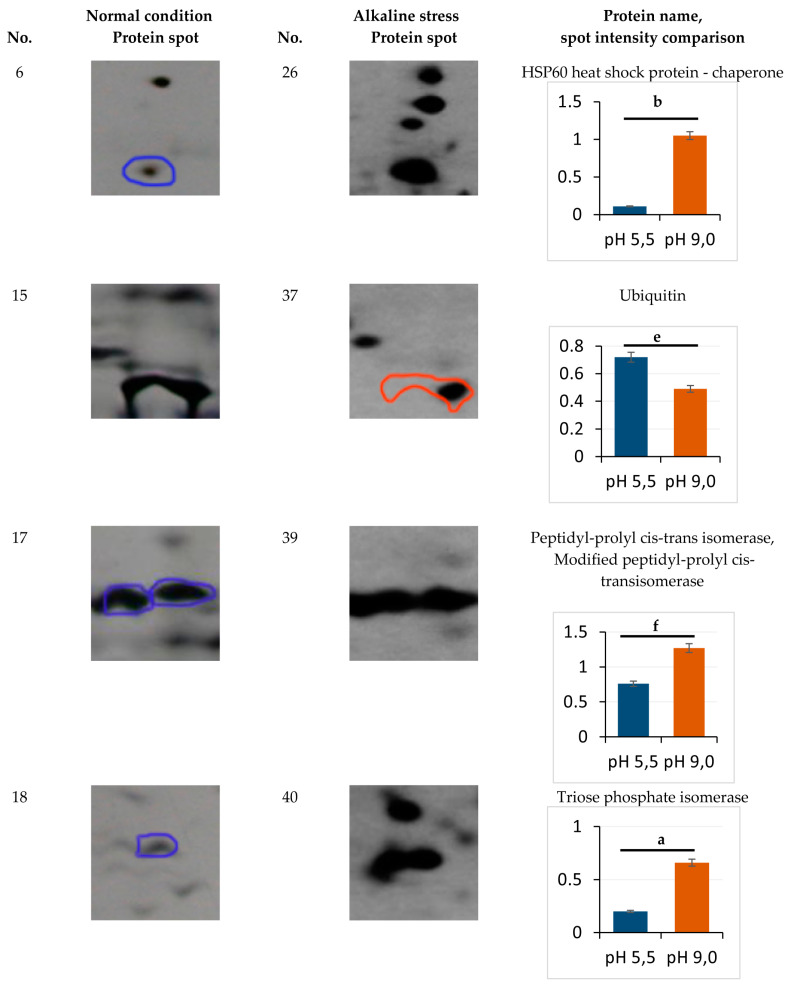
Figure 3.
Enlarged sectors of the 2-DE gels including the identified proteins, which were differentially expressed under normal (left) and alkaline stress (right) conditions. The rightmost column shows the normalized amount of each protein spot. a—p < 0.04; b—p < 0.05; c—p < 0.03; d—p < 0.02; e, f—did not differ significantly. Values are mean ± S.E.M from five independent experiments and three analytical replicates. Symbols: overexpressed proteins under normal (blue circle) and alkaline stress (red circle) condition.


