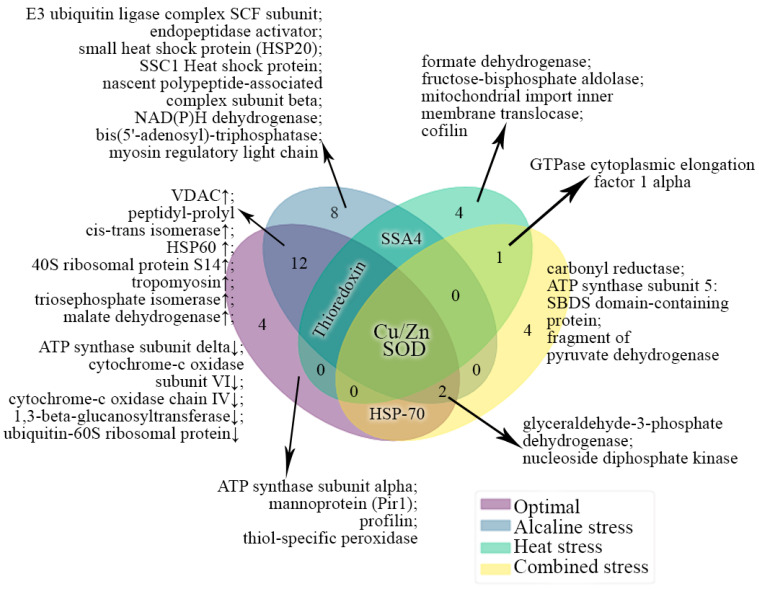
Figure 6.
Clustering of differentially expressed proteins according to the frequency of their occurrence under various growth conditions. Different clusters of interacting proteins were identified using the STRING software with the highest conformity score. Different colors indicate the conditions of growth. The number of the common proteins for different conditions are indicated by the figures.

