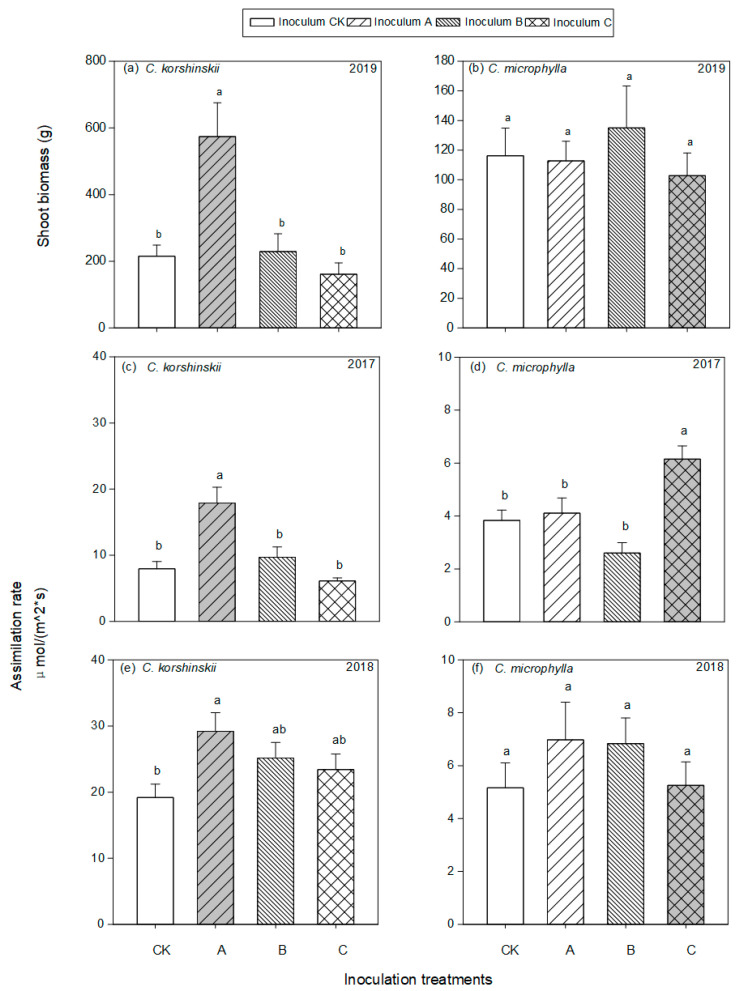
Figure 2.
Shoot biomass (a,b) and photosynthetic rate (c–f) of C. korshinskii and C. microphylla plants in 3 years. Inoculation treatments including inocula originating from rhizosphere of C. korshinskii (A), H. leave (B), C. microphylla (C) and sterilized control (CK). Bars indicate means with standard error (n = 7 for shoot biomass and n = 14 for photosynthetic rate). Different letters above bars indicated significant differences at p < 0.05 level according to Tukey’s test. Grey bars indicated home AMF and plant combinations.

