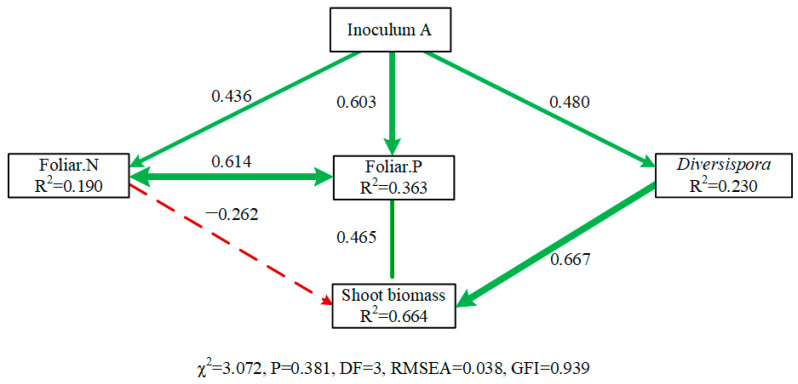
Figure 4.
Structural equation model (SEM) showed home AMF inoculation effects on C. korshinskii plant performance. Solid and dashed lines indicated significant (p < 0.05), and non-significant pathways (p > 0.05). The double headed arrow indicated correlations. Numbers above the arrows showed the standardized path coefficients. Arrow width is proportional to the strength of different pathways. Green and red lines indicated positive and negative pathways. R2 below each dependent variable represented the proportion of variance explained.

