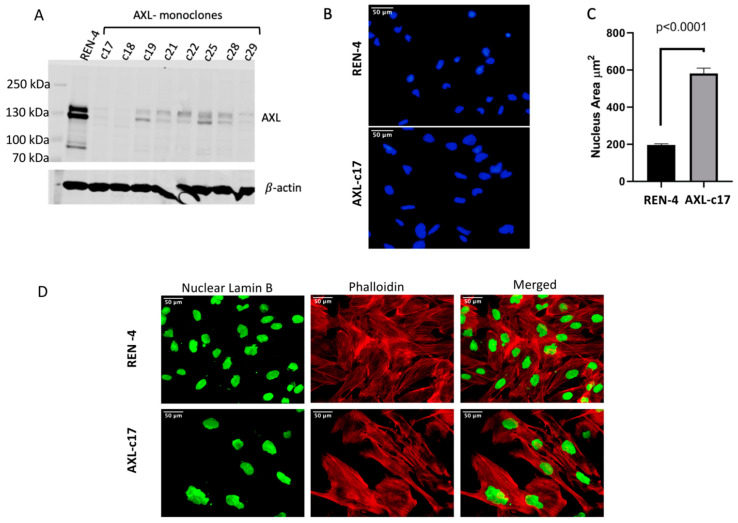
Figure 2.
Expression levels of AXL in monoclones, REN-4 and AXL-c17, and changes in morphology and nucleus size. (A) 138 kDa AXL expression was detected in REN-4 negative control cells and AXL-monoclones except for the c17 and c18. β-actin served as a loading control. (B) Nucleus staining by DAPI (blue) in REN-4 (top) and AXL-c17 (bottom). (C) Nuclear areas were calculated by Image J program. Significantly larger nucleus sizes were observed in AXL-c17 (p < 0.0001) (D) Phalloidin (red) which stains F-actin protein, highlights the differences in cell morphology and nuclear lamin B (green) shows the nucleus differences.

