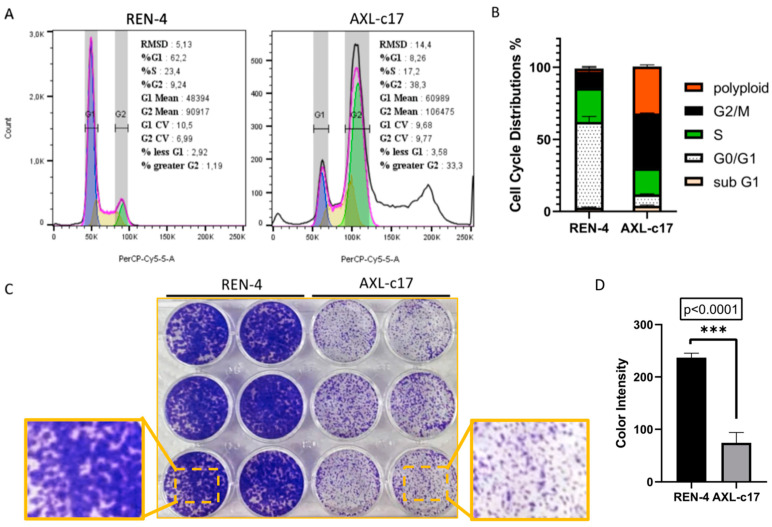
Figure 3.
Cell cycle and colony formation of control and AXL knock-out cells. (A) DNA content from cell cycle analysis of REN-4 (left) and AXL-c17 (right) were shown. (B) Percentage of cell cycle distribution of both REN-4 and AXL-c17 cells. (C) Colony formation of REN-4 and AXL-c17 cells. Left 6 wells, and right 6 wells depict REN-4 and AXL-c17 cells, respectively. The focused area was displayed with dashed lines. (D) The color intensities of colony formations of REN-4 (black) and AXL-c17 (gray) were calculated by Image J. (*** p > 0.0001).

