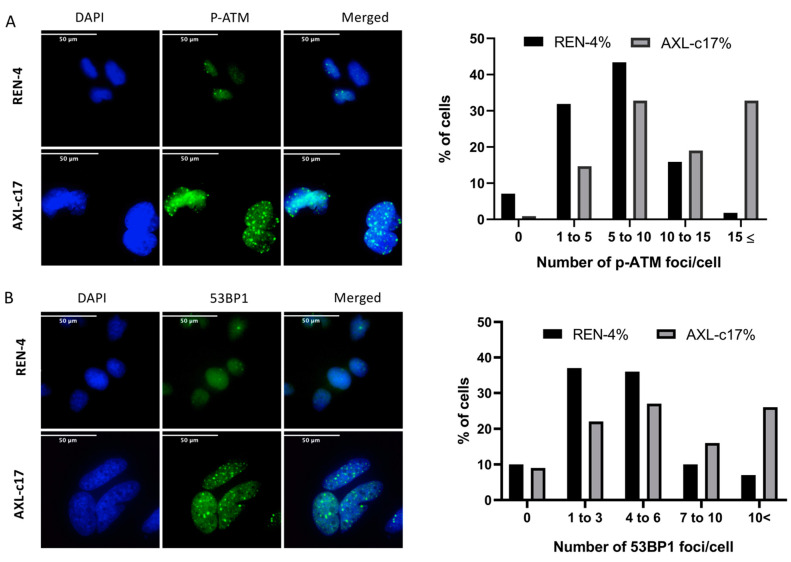
Figure 4.
Foci formation as a marker of DNA damage response in AXL knock-out cells. Representative immunofluorescent image (left) and number of foci per cell distribution (right) of (A) p-ATM (Ser1981) and (B) 53BP1. Approximately 300 cells were counted for quantification. DAPI (blue) stains nucleus and foci were shown with green dots. The 53BP1 and p-ATM foci number per single cell was grouped as 0, 1–3, 4–6, 7–10, and greater than 10, and 1–5, 5–10, 10–15, and greater than 15, respectively.

