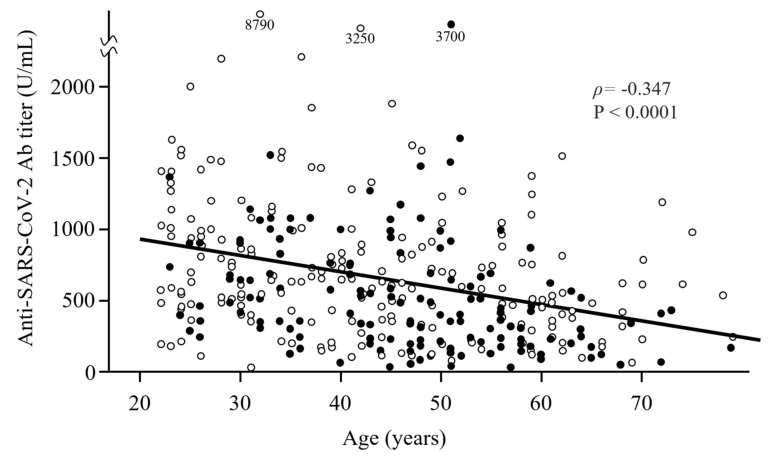
Figure 1.
Scatter plot of the distribution of Ab titers 6 months after the second vaccine dose according to age and smoking status. Older participants had significantly lower Ab titers. Closed and open circles show ever-smokers and never-smokers, respectively. Ever-smokers had lower Ab titers than never-smokers.

