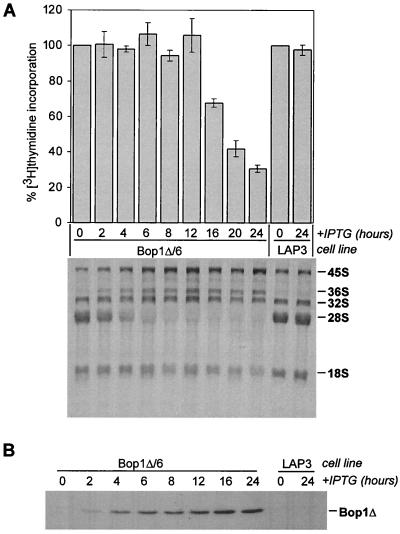
FIG. 4.
Time course of Bop1Δ induction and its effects on DNA synthesis and rRNA processing. (A) The Bop1Δ and LAP3 cell lines were treated with IPTG for the indicated times, and their rates of DNA synthesis (top) were determined by measuring incorporation of [3H]thymidine. Histograms show the average counts per minute in quadruplicate samples, expressed as a percentage of that in untreated cultures; error bars indicate standard deviation. For analysis of rRNA processing (bottom), RNA from cells undergoing parallel treatment and labeled with [3H]uridine was separated on an agarose gel, transferred to a nylon membrane, and visualized by fluorography. Positions of mature 28S and 18S rRNAs and major precursors are marked. (B) Bop1Δ detected by immunoblotting with anti-Bop1 antibodies at various times after IPTG induction in Bop1Δ/6 cells. Parental LAP3 cells were used as a control.

