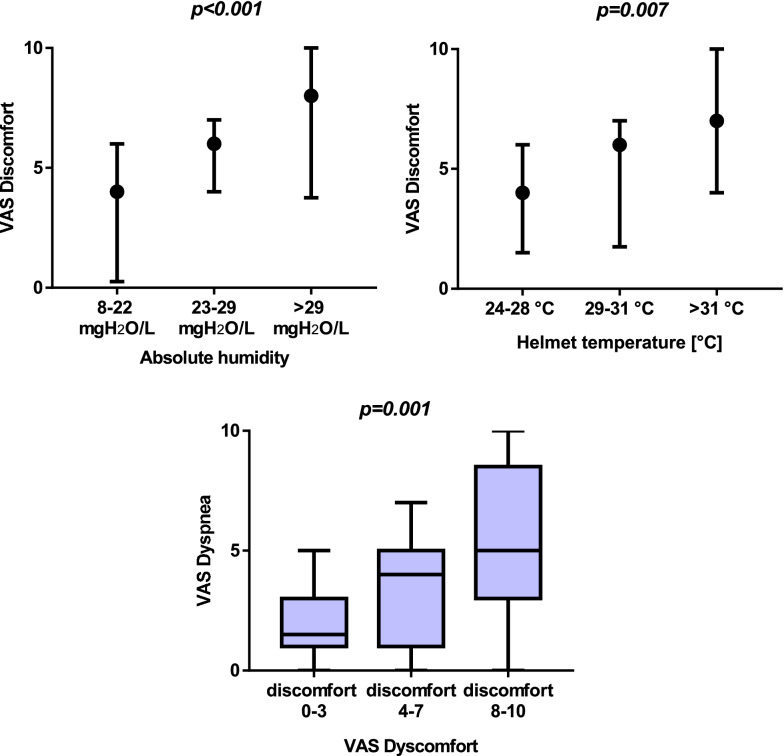
Fig. 4.
Upper panels show the relationship between absolute humidity (left) and temperature (right), respectively, and VAS discomfort. Values of humidity and temperature on the x axis are divided in lower, middle and upper tertiles in the whole cohort of measurements (i.e., all measurements from the four study steps). Medians (black circles) and interquartile ranges are displayed. Discomfort increased at raising humidity and temperature across all steps. Lower panel illustrates the relationship between VAS discomfort (presented on the x axis as low, intermediate and high discomfort levels) and VAS dyspnea in the whole cohort of measurements, showing how raising discomfort is associated to increasing subjective dyspnea (independently of the gas conditioning strategy used). Data in this panel are presented as a boxes-and-whiskers plot, the boxes indicating median [interquartile range] and the whiskers indicating minimum and maximum value

