TABLE 2.
Summary of cell characteristics among sorting gates using flow cytometry.
| Gate | ||||
|---|---|---|---|---|
| P1 | P2 | P3 | ||
| Gate properties | High FSC-A | Medium FSC-A | Low FSC-A | |
| High SSC-A | Low SSC-A | Low SSC-A | ||
| cell types | stage I | ASG 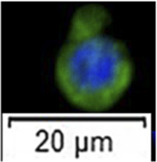
|
few ASG 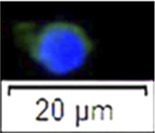
|
SC 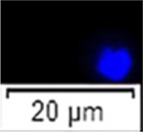
|
| stage II | BSG 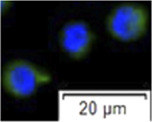
|
SC 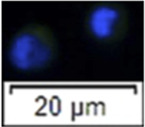
|
||
| stage III | BSG, spermatocyte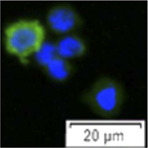
|
spermatocyte, SC 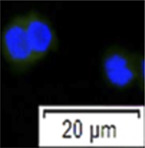
|
||
| expressed marker genes | plzf, kitr, dnd1, boule | - | - | |
FSC-A, Forward scatter-Area; SSC-A,Side scatter-Area; ASG, type A spermatogonia; BSG, type B spermatogonia; SC, somatic cells.
