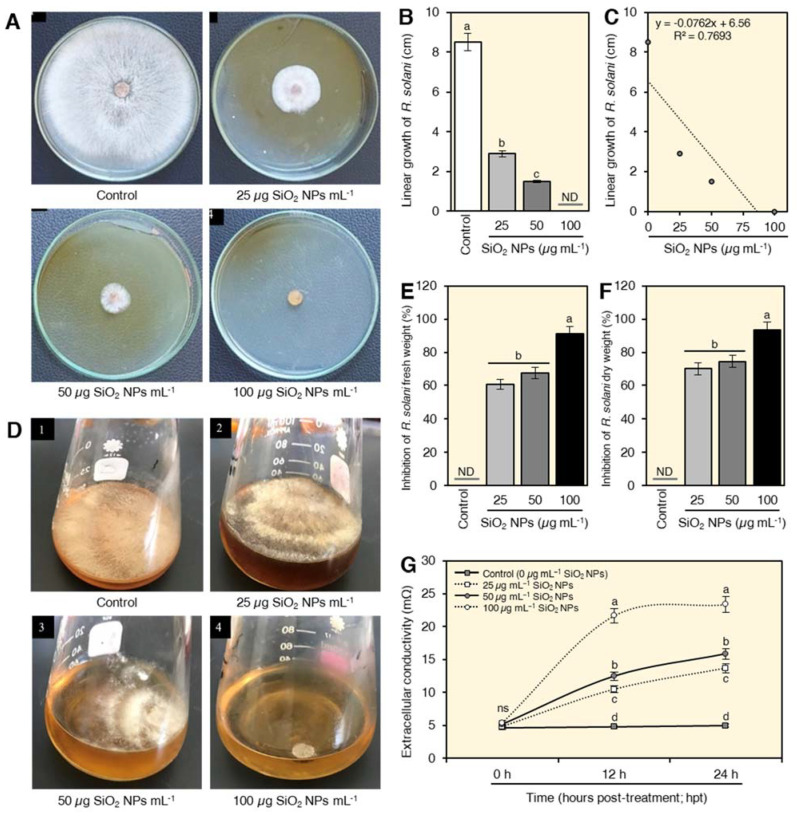
Figure 3.
In vitro antifungal activity of silicon dioxide nanoparticles (SiO2 NPs) against R. solani, the causal agent of wheat damping-off. (A) Antifungal activity of different concentrations (0 [control], 25, 50, and 100 µg mL−1) of SiO2 NPs against R. solani growing on PDA medium in Petri dishes. (B) Linear growth (cm) of R. solani after the treatment with different concentrations of SiO2 NPs. (C) Simple linear regression between linear growth (cm) of R. solani and different concentrations of SiO2 NPs (0, 25, 50, and 100 µg mL−1). (D) Antifungal activity of different concentrations (0 [control], 25, 50, and 100 µg mL−1) of SiO2 NPs against R. solani growing on liquid medium. (E,F) Inhibition (%) of R. solani fresh and dry weight, respectively, after the treatment with different concentrations of SiO2 NPs. (G) Effect of different concentrations of SiO2 NPs on the extracellular conductivity of R. solani suspension at 0, 12, and 24 h post-treatment (hpt). The experiments were repeated twice independently. In bar graphs, data presented are means ± standard deviation (mean ± SD) of five biological replicates. Different letters indicate statistically significant differences among treatments, while the same letters signify no significant differences between them according to Tukey’s honestly significant difference test (p < 0.05). In simple linear regression graphs, the linear fit regression line is presented as a dotted line, regression equation and R2 are also presented within the graph.

