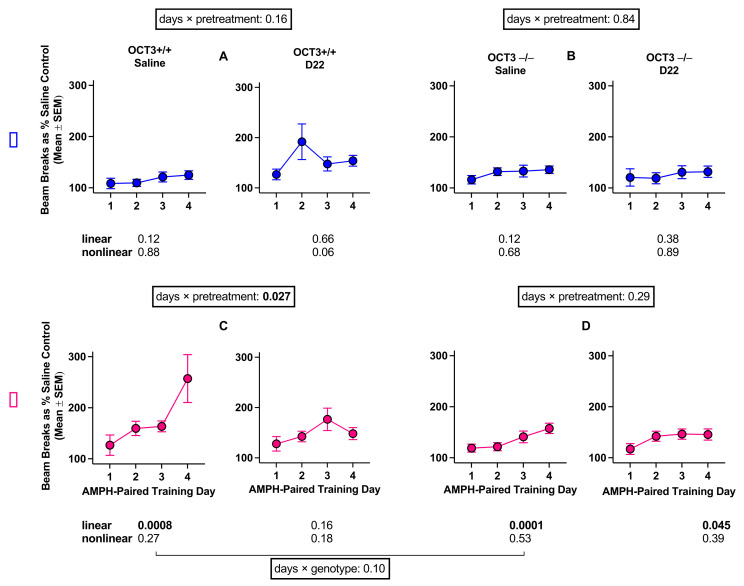
Figure 3.
Sensitization to the locomotor stimulating effects of amphetamine (AMPH) in male (A,B) and female (C,D) organic cation transporter 3 (OCT3) wild-type (+/+) and OCT3 knockout (−/−) mice treated with saline or decynium 22 (D22) before amphetamine. Each part of the figure (A–D) shows the p value for the days by pretreatment interaction for each genotype and each sex. In addition, a p value is shown for the comparison of genotypes in saline-pretreated females. Additionally, each of the 8 panels (n = 16 mice per panel) shows p values for linear and nonlinear trends across days. Statistically significant p values are shown in bold.

