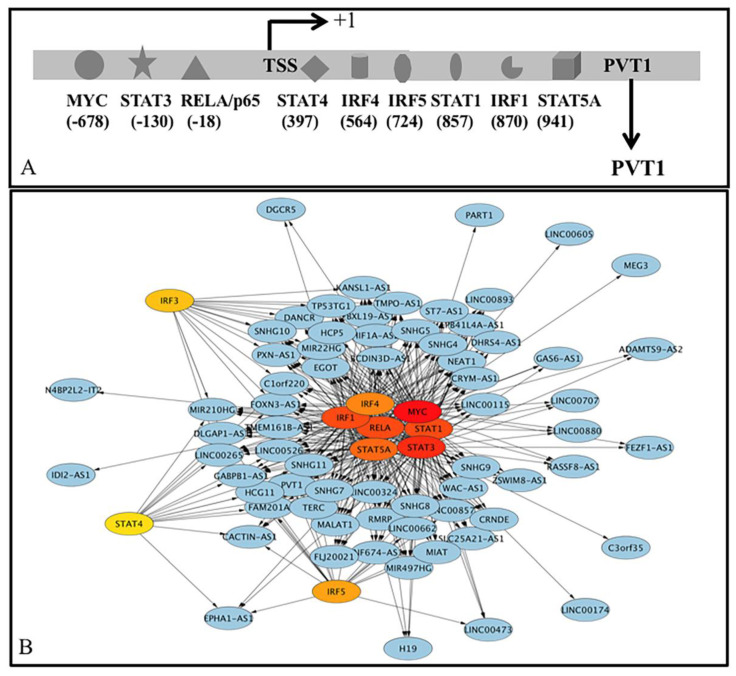
Figure 8.
(A) (top panel): Binding of TFs to the putative promoter (−5 Kb to +1 Kb) of PVT1. Nine TFs IRF1 (binding positions 883 and 870 from the TSS), IRF4 (568, 564), IRF5 (724), MYC (933, 911, 862, 850, 832, 827, 824, 758, 711, 697, 455, 438, 434, 385, 365, 274, 191, 184, 163, 126, 98, 57, 45, 34, 31, 21, 20, 19, 3, −24, −54, −460, −617, −628, −678, −1454), RELA/p65 (974, 949, 932, 900, 894, 875, 863, 841, 831, 826, 806, 791, 679, 678, 677, 669, 657, 652, 652, 643, 633, 627, 626, 620, 612, 611, 603, 597, 596, 565, 341, 247, 18, −8), STAT1 (857,−4693), STAT3 (986, 844, 826, −130), STAT4 (397), STAT5A (941, 928) could bind to the putative promoter. Among the several binding sites observed from ChIPBase, only one site is shown in Figure. Positions indicate the distance from the transcription start site (TSS). Distances shown are not in scale. (B): (lower panel) Top ten interactions of TFs with lncRNAs represented by online software by Cytoscape. TF-Gene network being directional, the edges, connecting the nodes [TFs (shown in red and yellow filled ovals) and lncRNA (light blue)] are shown by arrows.

