Figure 1.
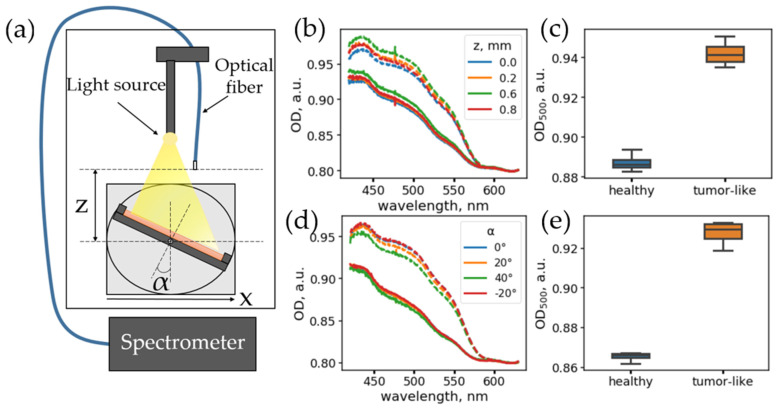
(a) Scheme of a single-fiber setup for measuring reflected light spectra. (b) Dependence of optical density (OD) spectra on the fiber position above the surface, z, for phantoms of normal tissue (solid lines) and tumor tissue (dashed lines). (c) Boxplots for optical densities of phantoms of normal (blue) and tumor (orange) tissue. Each box represents all the spectra measured for different positions, z. (d) Dependence of the OD spectral shape on the angle, α, between the fiber and the phantom surface. Solid lines correspond to the spectra of normal tissue; dashed lines correspond to tumor tissue phantom. (e) Boxplots for optical densities of phantoms of normal (blue) and tumor (orange) tissues. Each box represents all the spectra measured for different angles α.

